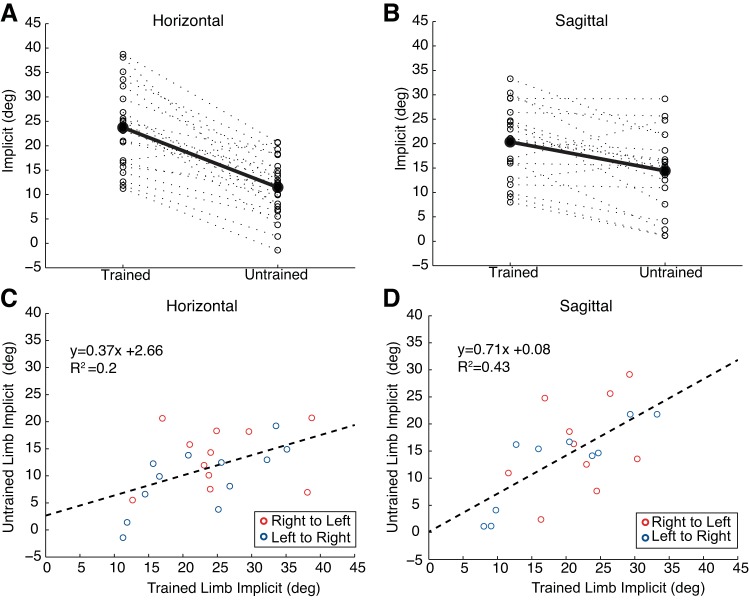
Fig. 5.
Correlation between the amount of implicit learning in the trained and untrained limb for the horizontal and sagittal conditions. A and B: extent of implicit learning over the last 2 blocks of probe trials for each participant in the trained and untrained limb. Solid lines indicate the amount of implicit learning in the horizontal (A) and sagittal (B) condition averaged across all participants. C and D: linear regression to predict implicit transfer based on the level of implicit learning for the trained limb in the last 2 blocks of probe trials. The slope for horizontal groups (0.37) was lower than for sagittal groups (0.71). Each point on the graph is indicative of a single participant (red, transfer from right to left; blue, transfer from left to right).

