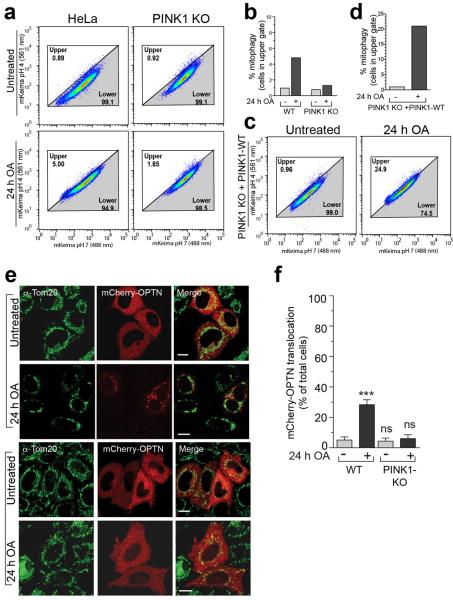
Extended Data Figure 6. PINK1 directly stimulates mitophagy upon mitochondrial damage.
Representative data of mt-mKeima-expressing a, WT, PINK1 KO or c, PINK1 KO rescued with PINK1-WT cells treated with OA then analyzed by FACS. b, d, Average percent mitophagy for two replicates of a and c, respectively. e, Representative images of WT HeLa cells expressing mCherry-OPTN and treated with OA as indicated were immunostained for Tom20 (n=3). f, Quantification of mCherry-OPTN translocation from cells in e. Data displayed as mean ± s.d. from 3 independent experiments and using one-way ANOVA tests (***P<0.001, ns, not significant).

