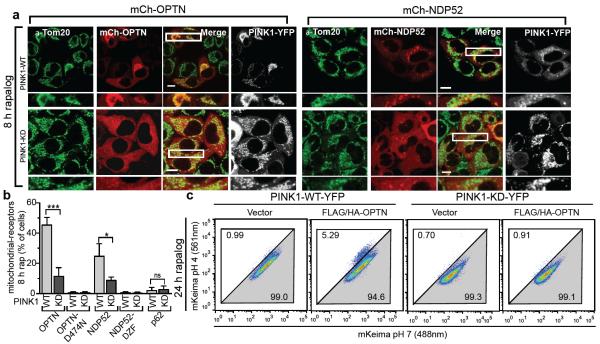
Figure 3. PINK1 recruits Optineurin and NDP52 independent of Parkin to promote mitophagy.
a, Representative images of HeLa cells expressing FRB-Fis1, WT (PINK1-WT) or kinase-dead (PINK1-KD) PINK1Δ110-YFP-2xFKBP and mCherry-OPTN (mCh-OPTN) or mCherry-NDP52 (mCh-NDP52) treated with rapalog. b, Quantification of receptor translocation in cells from a and Extended Data Fig. 4c–e. >100 cells were counted per sample. c, Cells were treated with rapalog and analyzed by FACS for lysosomal positive mt-mKeima. Representative data for WT or KD PINK1Δ110-YFP-2xFKBP in pentaKOs without or with FLAG/HA-OPTN expression. Quantification in b is displayed as mean ± s.d. from 3 independent experiments and uses one-way ANOVA tests (***P<0.001, *P<0.05, ns, not significant). For images of untreated cells from a, see Extended Data Fig. 4b. Scale bars, 10 μm.

