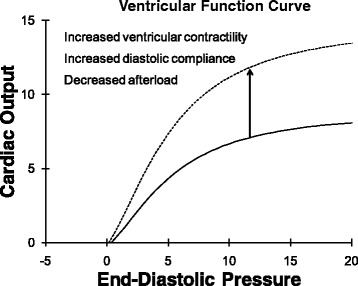
Fig. 1.

This classic ventricular function curve relates input of the heart (end-diastolic pressure in mmHg) to output of the heart (cardiac output in liters per minute). The ventricular function curve shifts up and to the left when ventricular systolic contractility increases. However, increased diastolic compliance and decreased afterload can also shift the ventricular function curve up and to the left
