Fig. 3.

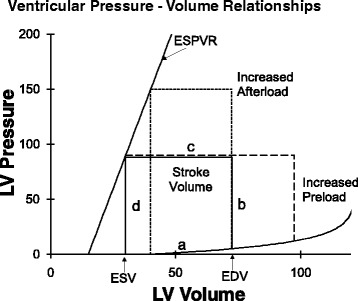
Left ventricular pressure volume relationships. A cardiac cycle is illustrated by the loop labeled as “a”, “b”, “c”, and “d”. ESPVR end-systolic pressure–volume relationship, LV left ventricular

Left ventricular pressure volume relationships. A cardiac cycle is illustrated by the loop labeled as “a”, “b”, “c”, and “d”. ESPVR end-systolic pressure–volume relationship, LV left ventricular