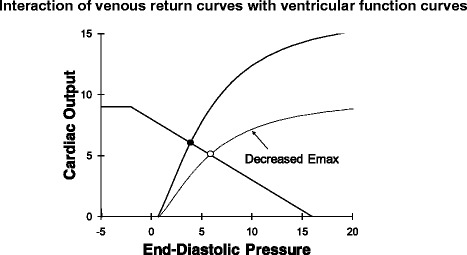
Fig. 9.

Ventricular function curves can be plotted on the same set of axes and venous return curves. In steady state cardiac output must equal venous return so the intersection (filled circle) identifies the cardiac output and end-diastolic pressure of the cardiovascular system. A decrease in cardiac function results in a decrease in cardiac output and an increase in end-diastolic pressure (open circle)
