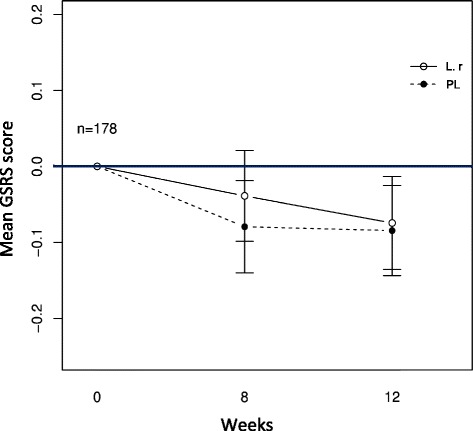
Fig. 2.

Changes in the primary outcome parameter over the study period. The figure shows change from baseline in GSRS total mean score in the two treatment groups, throughout the intervention period. 178 subjects were included in the analysis, excluding participants taking PPI and GMMS during the study. (Prob) indicates the probiotic group receiving treatment with L. reuteri (n = 86) and (PL) indicates the placebo group (n = 92)
