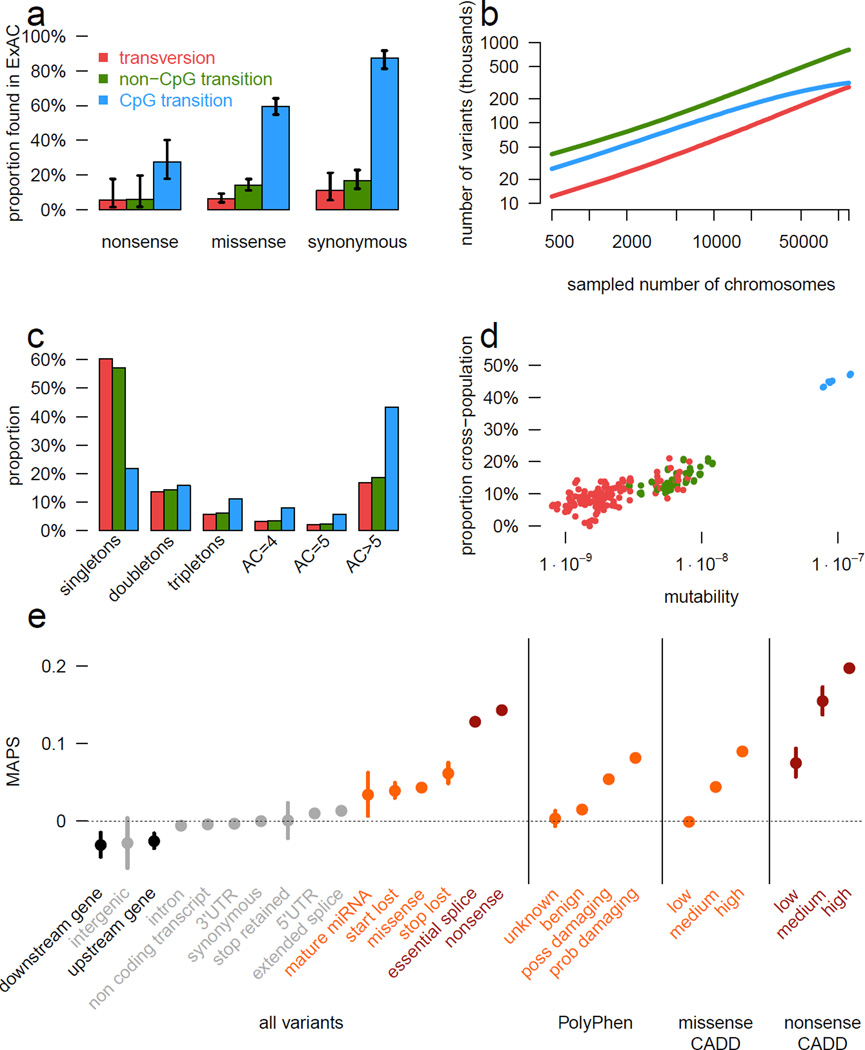
Figure 2. Mutational recurrence at large sample sizes.
a) Proportion of validated de novo variants from two external datasets that are independently found in ExAC, separated by functional class and mutational context. Error bars represent standard error of the mean. Colors are consistent in a-d. b) Number of unique variants observed, by mutational context, as a function of number of individuals (down-sampled from ExAC). CpG transitions, the most likely mutational event, begin reaching saturation at ~20,000 individuals. c) The site frequency spectrum is shown for each mutational context. d) For doubletons (variants with an allele count of 2), mutation rate is positively correlated with the likelihood of being found in two individuals of different continental populations. e) The mutability-adjusted proportion of singletons (MAPS) is shown across functional classes. Error bars represent standard error of the mean of the proportion of singletons.

