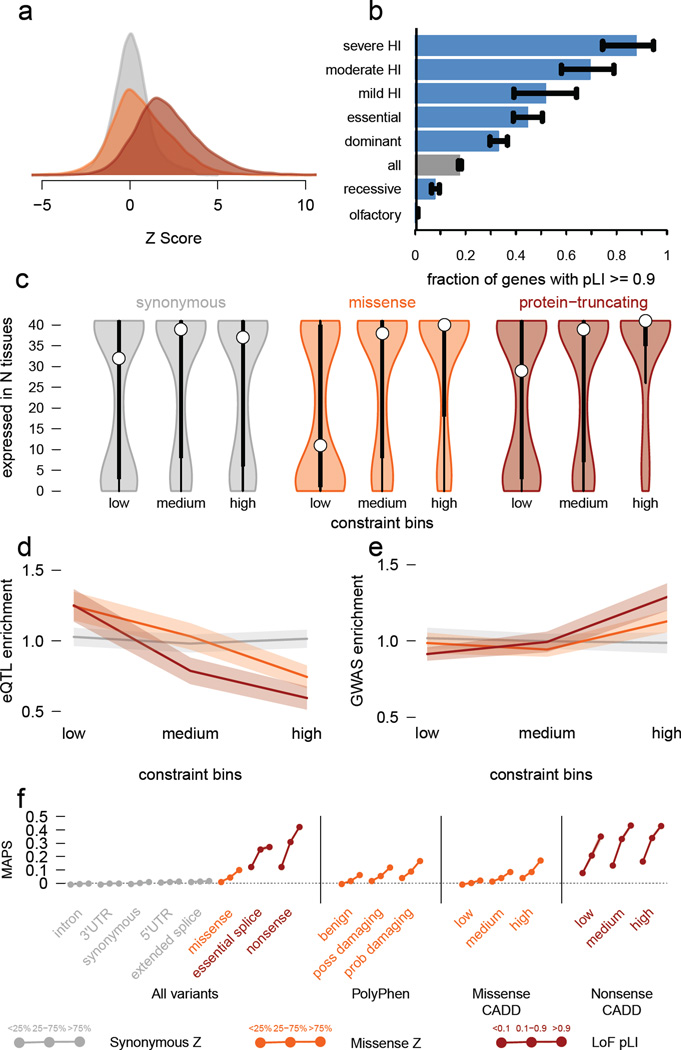
Figure 3. Quantifying intolerance to functional variation in genes and gene sets.
a) Histograms of constraint Z scores for 18,225 genes. This measure of departure of number of variants from expectation is normally distributed for synonymous variants, but right-shifted (higher constraint) for missense and protein-truncating variants (PTVs), indicating that more genes are intolerant to these classes of variation. b) The proportion of genes that are very likely intolerant of loss-of-function variation (pLI ≥ 0.9) is highest for ClinGen haploinsufficient genes, and stratifies by the severity and age of onset of the haploinsufficient phenotype. Genes essential in cell culture and dominant disease genes are likewise enriched for intolerant genes, while recessive disease genes and olfactory receptors have fewer intolerant genes. Black error bars indicate 95% confidence intervals (CI). c) Synonymous Z scores show no correlation with the number of tissues in which a gene is expressed, but the most missense- and PTV-constrained genes tend to be expressed in more tissues. Thick black bars indicate the first to third quartiles, with the white circle marking the median. d) Highly missense- and PTV-constrained genes are less likely to have eQTLs discovered in GTEx as the average gene. Shaded regions around the lines indicate 95% CI. e) Highly missense- and PTV-constrained genes are more likely to be adjacent to GWAS signals than the average gene. Shaded regions around the lines indicate 95% CI. f) MAPS (Figure 2d) is shown for each functional category, broken down by constraint score bins as shown. Missense and PTV constraint score bins provide information about natural selection at least partially orthogonal to MAPS, PolyPhen, and CADD scores, indicating that this metric should be useful in identifying variants associated with deleterious phenotypes. Shaded regions around the lines indicate 95% CI. For panels a,c-f: synonymous shown in gray, missense in orange, and protein-truncating in maroon.

