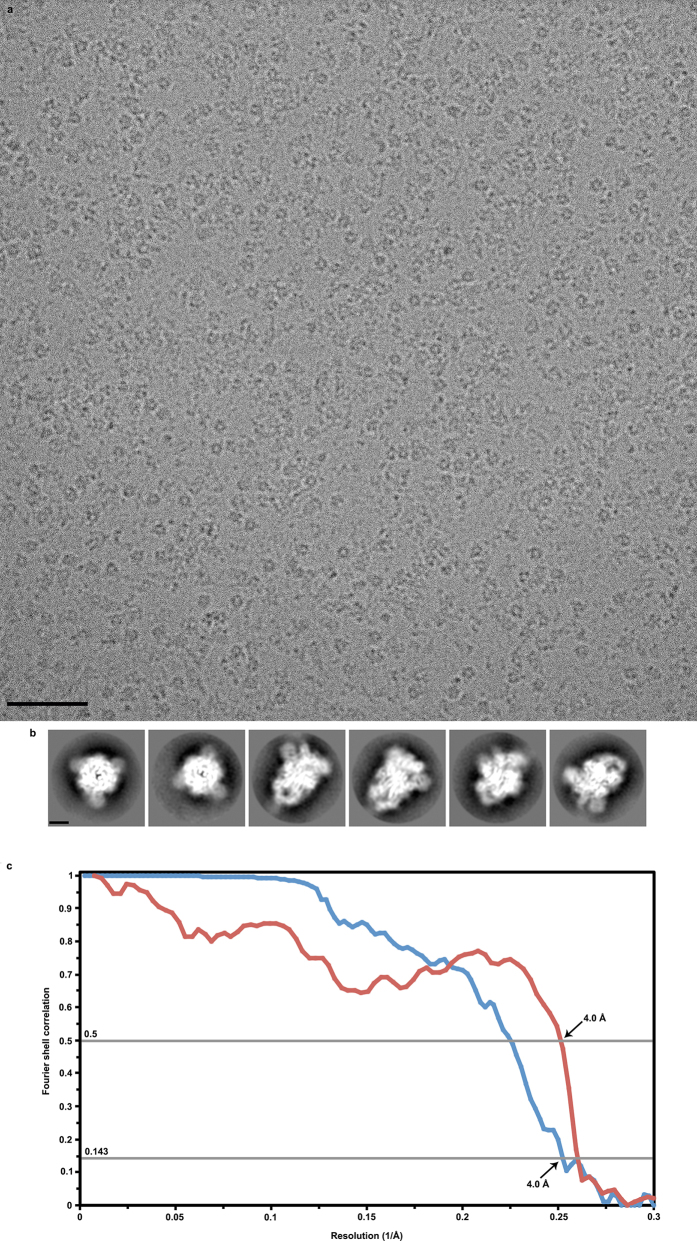
Extended Data Figure 2. CryoEM analysis of the MHV S trimer.
a, b, Representative electron micrograph (defocus: 4.6 μm) (a) and class averages (b) of the MHV S trimer embedded in vitreous ice. Scale bars: 573 Å (micrograph) and 44 Å (class averages). c, Gold-standard (blue) and model/map (red) Fourier shell correlation (FSC) curves. The resolution was determined to 4.0 Å. The 0.143 and 0.5 cut-off values are indicated by horizontal grey bars.

