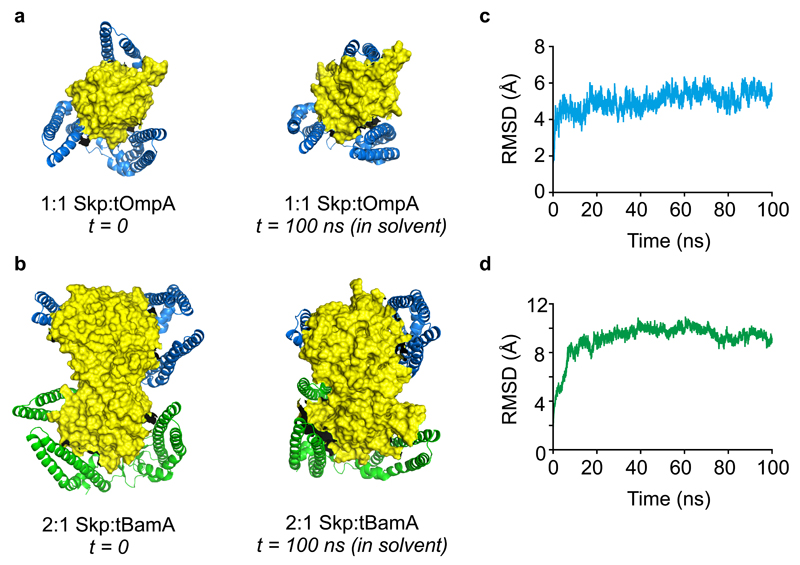
Figure 7. Molecular dynamics simulations of 1:1 and 2:1 Skp:OMP complexes in explicit solvent.
(a) Starting model of a 1:1 Skp:tOmpA complex used for MD simulations (left) (Supplementary Data Set 4) and the structure obtained after 100 ns of simulation in explicit solvent (right) (Supplementary Data Set 8). (b) Starting model of a 2:1 Skp:tBamA complex used for MD simulations (left) (Supplementary Data Set 6), with the two copies of Skp arranged in a side-by-side parallel orientation (Fig. 5c), and the structure obtained after 100 ns of simulation in explicit solvent (right) (Supplementary Data Set 9). (c,d) Backbone RMSDs calculated for the 100 ns simulations of (c) 1:1 Skp:tOmpA, and (d) 2:1 Skp:tBamA in explicit solvent, demonstrating that the complexes are stable over this timescale. Representative structures are shown from three independent MD simulations, and CCS values in the text are the mean ± standard deviation of three MD simulations.

