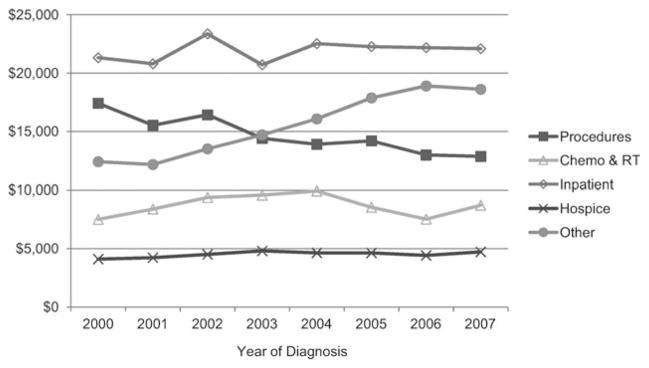
Figure 3.
Trends in mean costs are shown by category. Costs were estimated from Medicare reimbursement for health services within each category, adjusted for inflation and geographic variability. “Other” costs increased between 2000 and 2007 (P < .001). Procedure costs decreased (P < .001). Chemo indicates chemotherapy; RT, radiation therapy.

