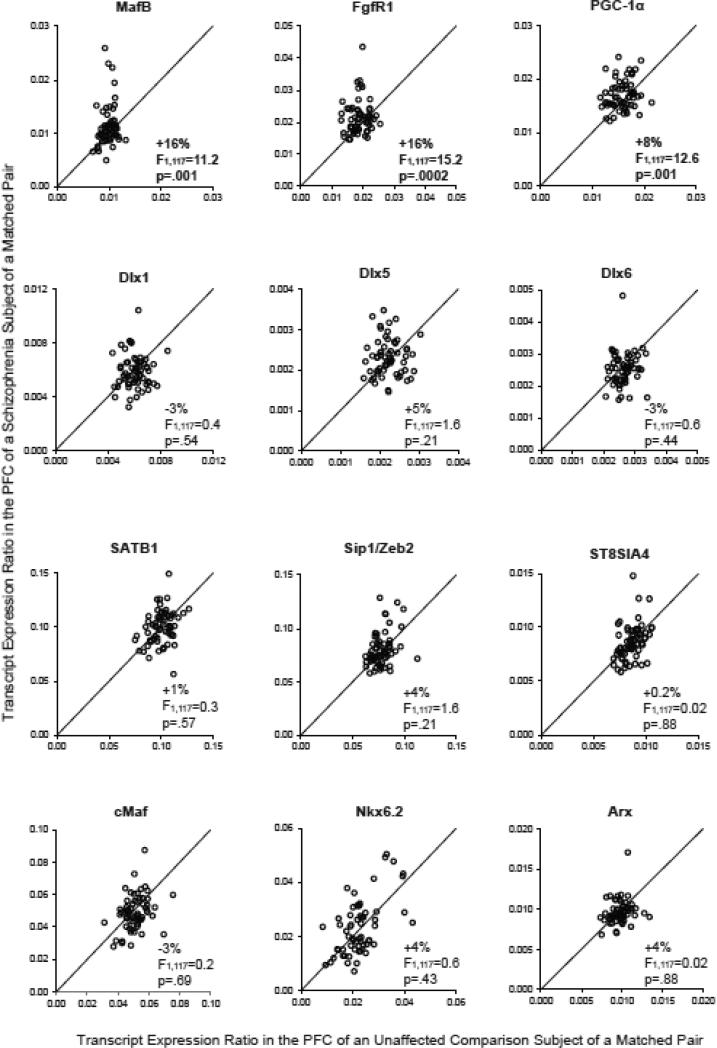
Figure 1. Quantitative PCR analysis of transcript levels of regulators of cortical parvalbumin and somatostatin neuron development in the PFC in schizophrenia.
Transcript levels for each schizophrenia subject relative to the matched unaffected comparison subject in a subject pair are indicated by open circles. Data points to the left of the unity line indicate higher mRNA levels in the schizophrenia subject relative to the unaffected comparison subject in a matched pair.

