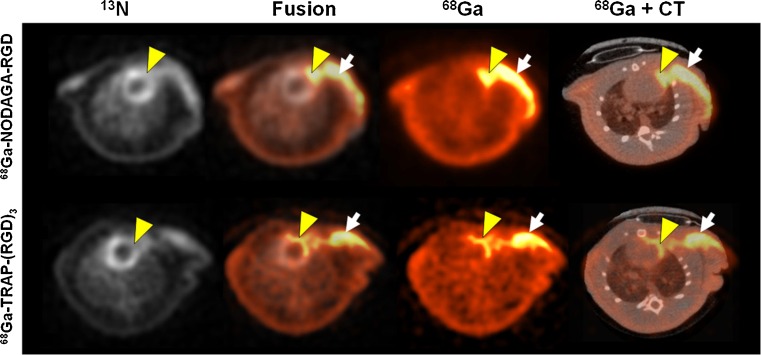
Fig. 1.
In vivo PET/CT images of rat MI. Representative transaxial sections show hypoperfused myocardium area (13N) and corresponding RGD uptake (68Ga, % ID/g). The focal uptake is seen in infarct (yellow arrowheads) and the operation scar (white arrows), as verified by CT scan (reprinted from [50] under the terms of the Creative Commons Attribution License 2.0)

