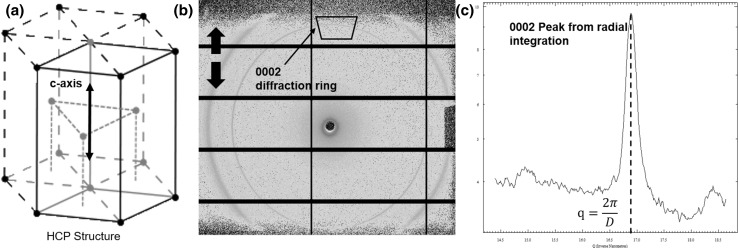
Fig. 5.
A typical example of WAXD spectra from bone material a a HCP structure of mineral platelet showing C-axis. b The bold black arrows represent the loading axis, and the black arrow indicate the 0002 diffraction ring to track tie c-axis in HCP structure. A black trapezium sector is used for a radial integration to obtain the 1D peak plot of 0002 diffraction ring. The black rectangular lattice on the detector can be neglected as they are regions used for measurements between active Cefaclor areas on the Plitatus P3-2M detector, c the azimuthally 1(q) 1D plot from the 2D trapezium section in (b)

