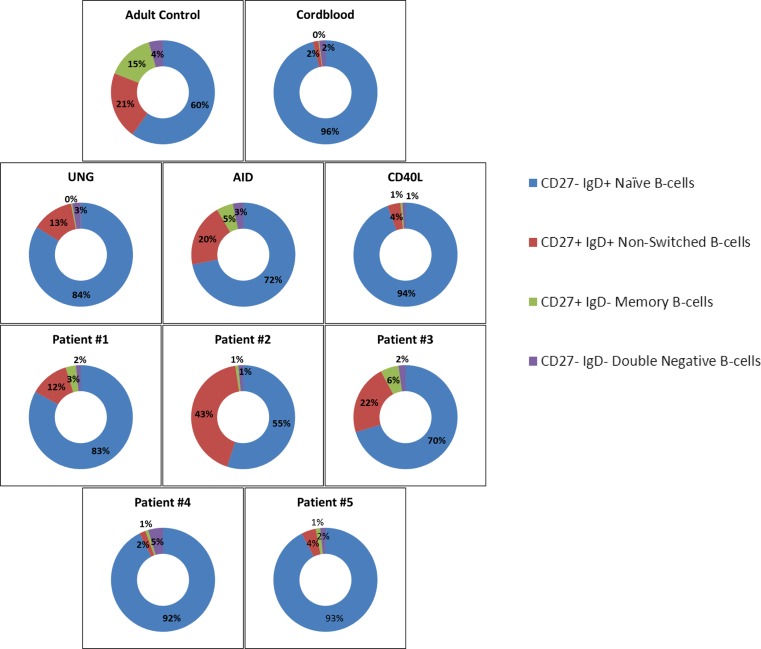
Fig. 4.
Representative diagrams of the circulating B cell phenotype at time of analysis. B cell subsets of representative blood samples from a healthy adult control, healthy cord blood, CD40L-, AID-, UNG-deficient CSR patients and five CSR-like CVID patients. Numbers indicate mean percentages of multiple experiments in the corresponding quadrant. Healthy adult controls (N = 20), healthy cord bloods (N = 15), CD40L-, AID- and UNG-deficient patients (N = 2–5), CSR-like CVID patients (N = 2–5)

