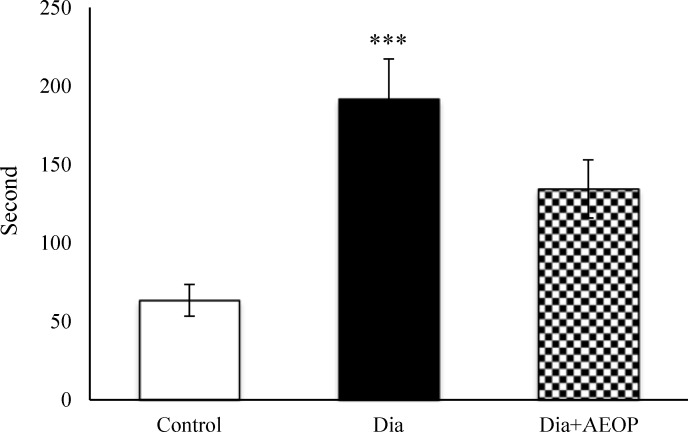
Figure 7.
Data one the STZ-induced diabetic rats both treated and not treated (Dia) with Purslane (Dia+AEOP, 300 mg/kg) and the control indicating NFMA in TPS. Each bar is represented as mean ± SEM and is analyzed by ANOVA followed by Tukey test. *: indicates the significant difference vs. control group (***: p≤0.001). In all the groups, n = 10

