
Figure 6.
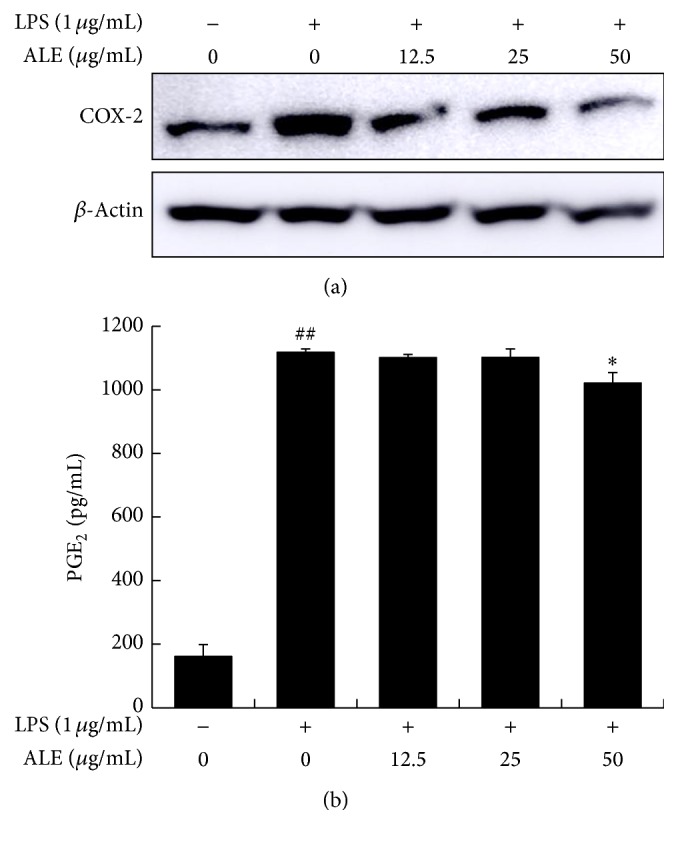
Effects of ALE on COX-2 expression and PGE2 production in Raw 264.7 cells. Cells were treated with various concentrations of ALE for 4 h and then activated with 1 μg/mL of LPS for 20 h. The COX-2 expression levels were then detected by western blot analysis (a), while PGE2 production was measured by ELISA. Values represented are the means ± SD. ## P < 0.01 compared to the NOR group and ∗ P < 0.05 compared to the CTL group (b).