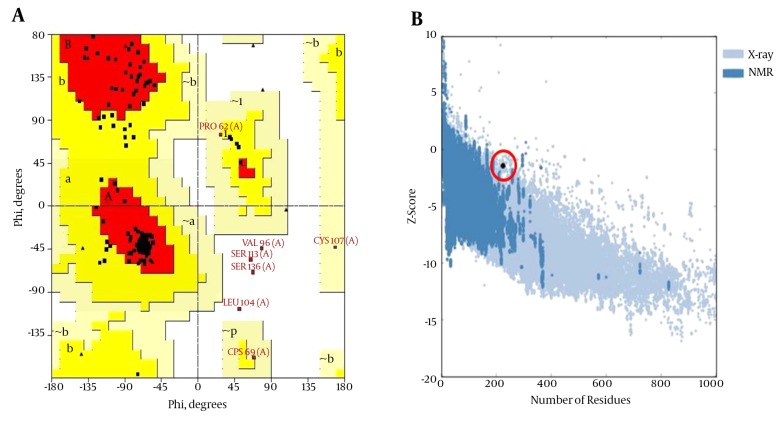
Figure 4. A, A Ramachandran Plot Generated by PROCHECK and B, the ProSA Z-Score for the HBsAg Model (Open Red Circle).
The residues in the most favored (red), additionally allowed (yellow), generously allowed (pale yellow), and disallowed regions (white) of the Ramachandran plot are indicated. The structures determined by different methods (X-ray, NMR) are distinguished by different colors in the ProSA Z-score plot.

