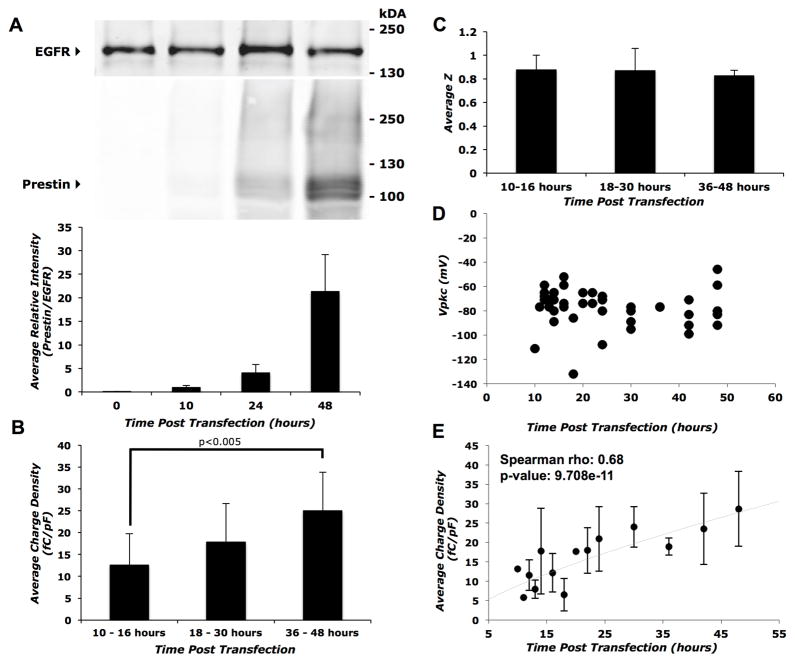
Figure 1. Time-course of prestin expression and function in transiently transfected HEK 293 cells.
A) Top panel: representative western blot of biotinylated cell surface proteins showing a gradual increase in prestin expression with time after transient transfection with HA-prestin. Bottom panel: average band intensity of prestin relative to EGFR calculated from three independent western blots as a function of time post-transfection. B) Average charge density for three groups of time points (10–16 hrs, 18–30 hrs, and 36–48 hrs). The 36–48 hour group showed a statistically significant increase (p<0.005) in comparison with the 10–16 hour group using the Student’s t-test with Holm adjustment of p-values for multiple comparisons. Sample size, n = 18, 14 and 11 for the 10–16, 18–30 and the 36–48 hour groups respectively. C) Average z values of prestin transfected cells at different time points post-transfection. There were no statistically significant differences in the unitary charge valence (z) with time post-transfection. Sample sizes were the same as in (B). D) Individual data points of Vpkc at time-points post transfection. The Vpkc remains fairly constant between 10 and 48 hours. Sample sizes were the same as in (B). E) Average charge densities of prestin transfected cells at different time-points post-transfection. Error bars represent standard deviation in all panels. Spearman rho correlation coefficient and associated p-value were calculated to estimate correlation significance.

