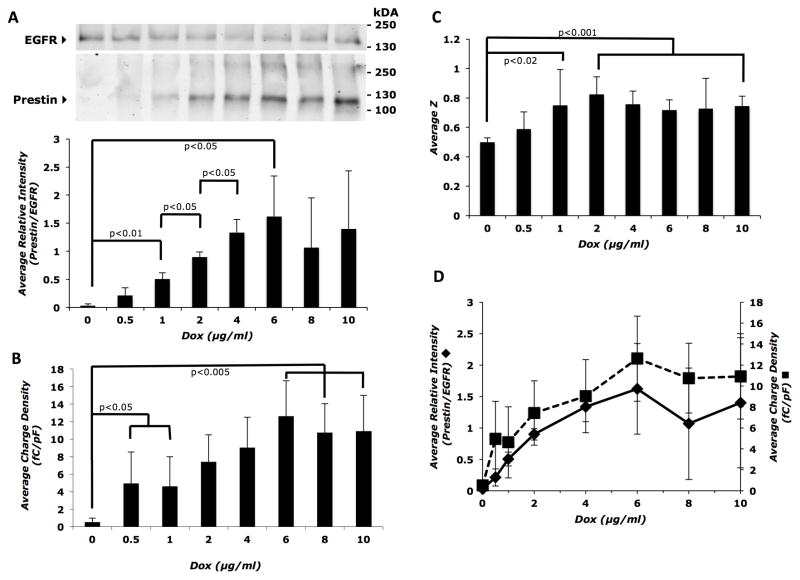
Figure 3. Membrane prestin expression and charge density increase as a function of inducer (Dox) dose.
A) Top panel: representative western blot of biotinylated cell surface proteins showing a gradual increase in prestin expression with inducer dose, reaching a maximum by 6 μg/ml Dox. Bottom panel: average band intensity of prestin relative to EGFR calculated from three independent western blots as a function of inducer dose. B) Average charge density at each inducer dose (n = 8 to 12 cells for each Dox dose) shows a corresponding increase that also reaches a plateau at 6 μg/ml Dox. C) Average z values increase with inducer dose up to 2 μg/ml and then remain constant. Sample sizes were the same as in (B). D) Dual axis plot showing parallel increases in membrane prestin expression (primary y-axis) and average charge density (secondary y-axis) as a function of inducer (Dox) dose. Error bars represent standard deviation in all panels. The Student’s t-test with Holm adjustment of p-values for multiple comparisons was used to estimate statistical significance; resulting p-values are indicated in each panel.

