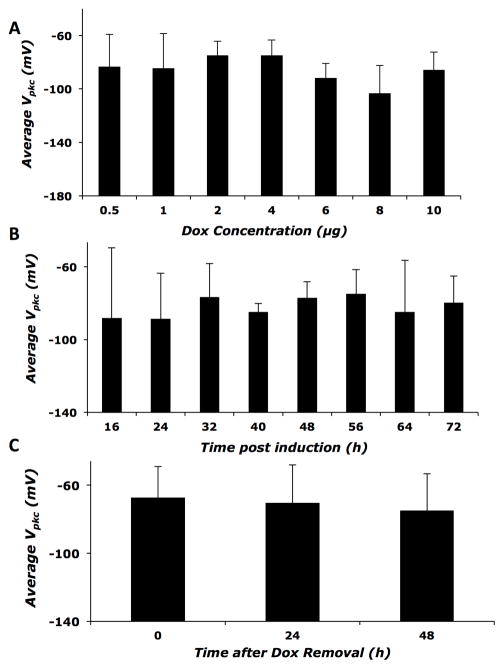
Figure 5. Vpkc shows no change as a function of prestin expression.
A) Average Vpkc of cells induced with various doses of Dox. B) Average Vpkc as a function of time after induction. C) Average Vpkc at 0 to 48 hours after removal of Dox. Error bars represent standard deviation in all panels. No statistically significant difference is seen among any of the treatment groups. Sample sizes are the same as mentioned earlier for the different treatments.

