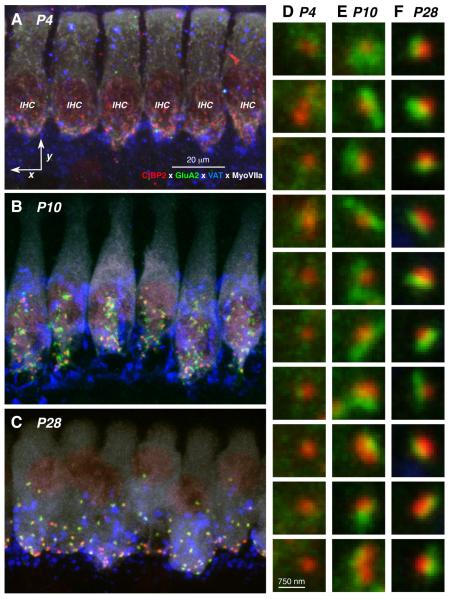
Figure 1.
Confocal images of the maturing cochlear nerve synapses on IHCs. A,B,C: Maximum projections of confocal z-stacks through 6 adjacent IHCs at the 11.3 kHz region, from cochleas at P4, P10 and P28, respectively. Scale bar in A also applies to B and C; staining key in A applies to all Panels. D,E,F: High-power views of representative synapses, in random order, from each of the three z-stacks shown in A, B and C, respectively, showing only the CtBP2 (red) and GluR2 (green) channels. Scale bar for all these thumbnails is shown at the bottom of column D.

