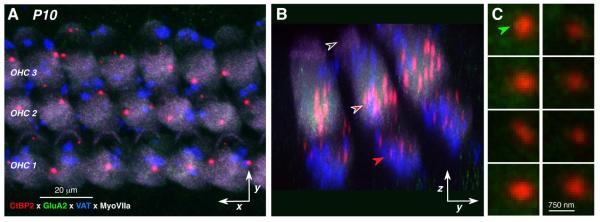
Figure 2.
Confocal images of P10 OHCs showing lack of GluA2-positive puncta. A,B: Maximum projections of confocal z-stacks through OHCs from the same case and cochlear region shown in Figure 1B: A is the x,y projection and B is the zy projection of the same image stack. Arrows in B point to 1) the cuticular plates from the 2nd row outer hair cells (black-filled), 2) the supranuclear ribbons (white-rimmed red arrow), and 3) the subnuclear ribbons (redrimmed red arrow). Key in A also applies to B. C: High power views of selected ribbons from A, showing only the CtBP2 (red) and GluR2 (green) channels. Green arrow points to the hint of GluA2 staining sometimes seen near the OHC ribbons. Scale bar bottom right applies to all thumbnails.

