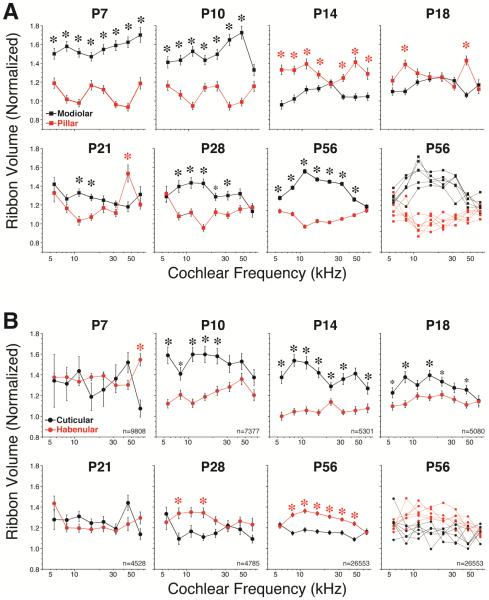
Figure 5.
Spatial gradients of ribbon sizes in the IHC area do not appear mature until at least P28, either along the modiolar-pillar axis (A) or the habenular-cuticular axis (B). Data at each age from P7 to P28 are extracted from 4 z-stacks at each frequency region: 2 from each ear of one animal. Each z-stack contains ~10 IHCs and therefore ~180 ribbon puncta, thus each point shows the mean (±SEM) of ~720 synapses from ~40 IHCs, and each panel includes data from ~5000 synapses along the cochlear spiral (total n’s are given at the bottom right of each panel in B). Data at P56 are extracted from 2 z-stacks at each frequency region from each of 12 ears from 6 animals. The data at P56 are shown in two ways: as the ensemble means and SEMs for all 12 ears, and again as the individual means for each of the six pairs of ears in this group: each of the latter graphs represents an identical sample size to the paired-ear data at each of the younger ages. Asterisks indicate statistically significant inter-group differences by one-way ANOVA: large asterisks for p < 0.001; small asterisks for p < 0.01.

