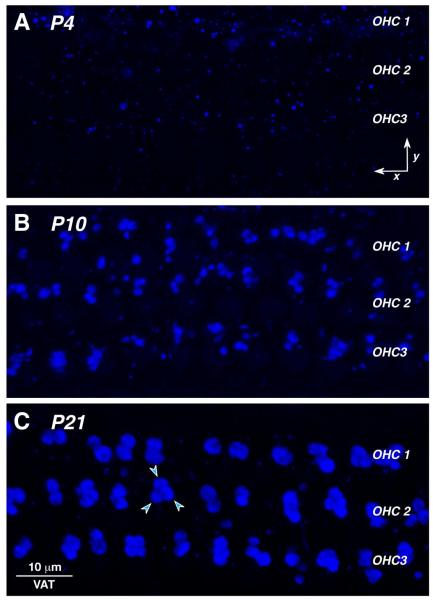
Figure 7.
Confocal images of the maturing efferent synapses on OHCs, as viewed in the acquisition (x,y) plane. Each image is the maximum projection of a z-stack from the 16 kHz region, encompassing 10-11 OHCs from each row. Arrowheads in C point to three efferent terminals at the base of one OHC. Scale bar in C applies to all panels.

