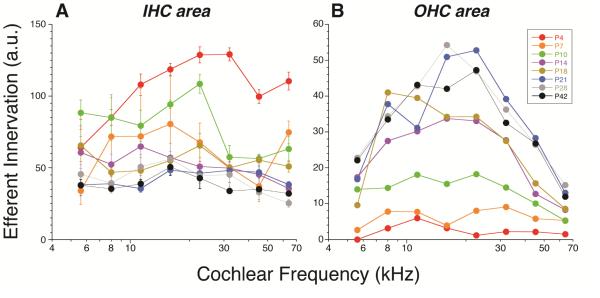
Figure 8.
Maturation of the density of olivocochlear efferent innervation in the IHC (A) and OHC (B) areas. Data are extracted from the same z-stacks described in Figure 1. Innervation density is estimated by measuring the silhouette areas of VAT-immunostained profiles in maximum projections such as those shown in Figure 7. See Methods for further details.

