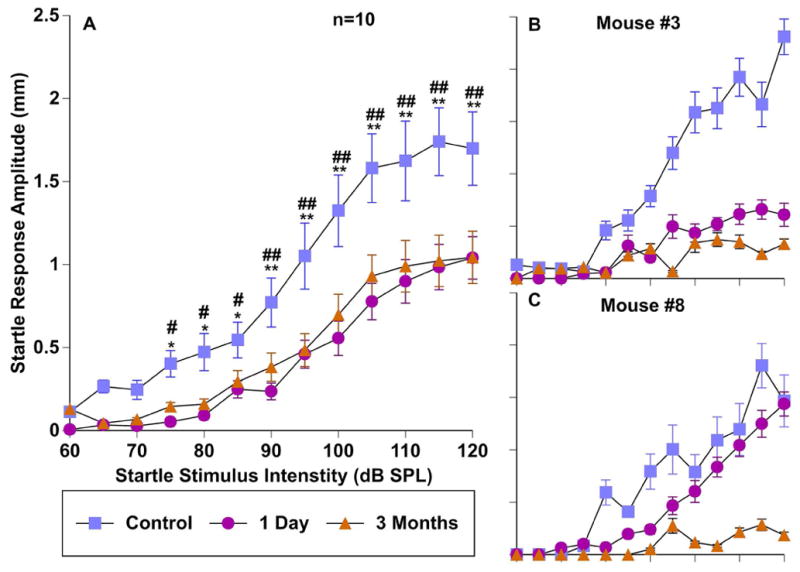
Figure 7.

Effect of sound exposure on startle response magnitudes. Startle responses across a range of startle intensities were measured before (control; blue), 1 day after (pink), and 3 months after exposure (orange). A: Group input/output function averages of 10 mice. B–C: input/output functions from two individual mice. Error bars show SEMs. * = significant difference between the control condition and one day after exposure; # = significant difference between the control condition and three months after exposure.
