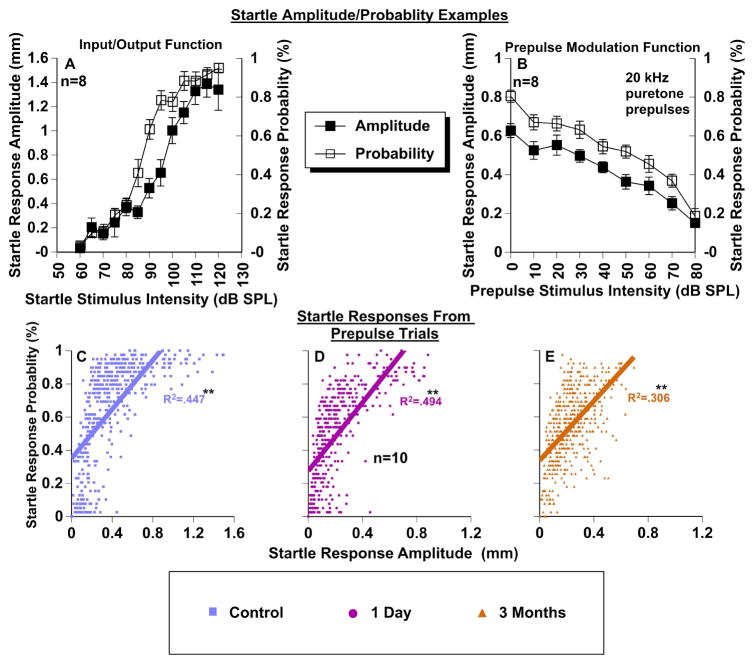
Figure 8.
Relationship between startle response amplitudes and startle probability. A: Representative input/output startle-only function from one control mouse comparing startle response amplitudes (left Y axis) and corresponding startle response probabilities (right Y axis) as a function of startle stimulus intensity. B: Representative prepulse modulation function (20 kHz pure tone prepulse) from one control mouse comparing startle response amplitudes (left Y axis) and corresponding startle response probabilities (right Y axis) as a function of prepulse stimulus intensity. C–E: Correlations between startle response amplitudes and startle response probability for each condition measured with PPI audiometry (data from Fig. 6A1-F1). Note: x-axis scales are different to accommodate data because of net losses in startle response magnitudes after sound exposure. * = significant correlation.

