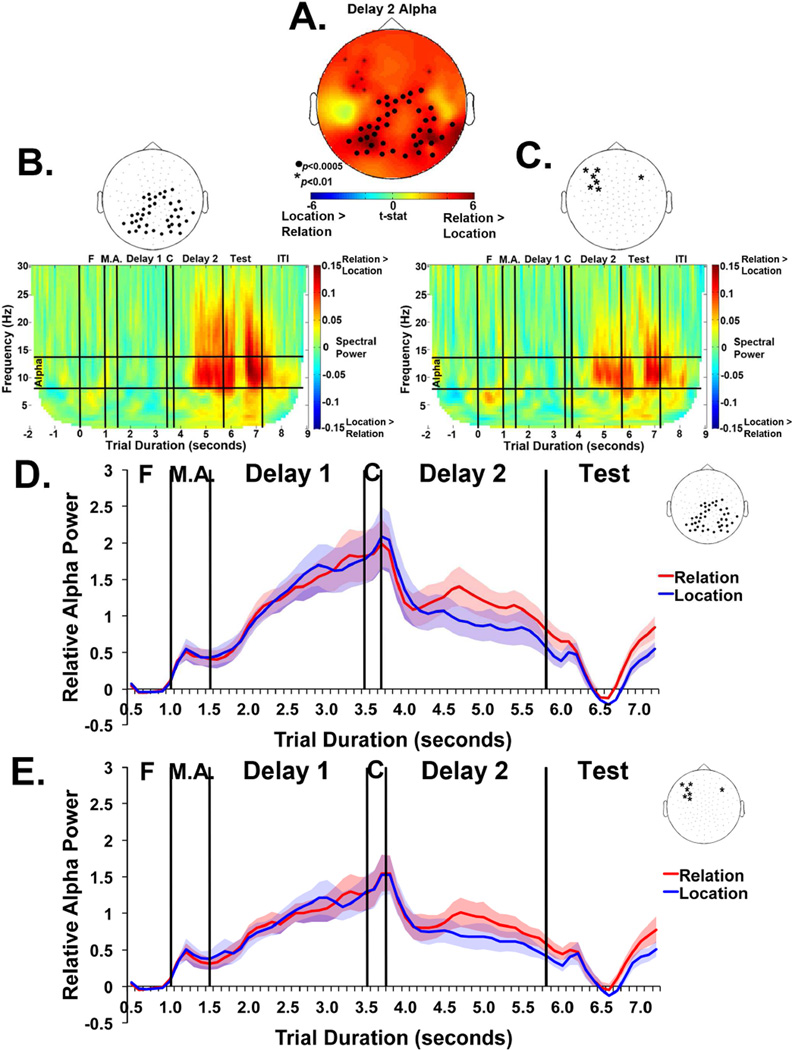
Figure 3.
(A) Results from nonparametric randomization test comparing Relation vs. Location for Delay 2 period alpha. (B) Significant posterior electrodes and their corresponding TFR. (C) Significant frontal electrodes and their corresponding TFR. Warmer colors indicate more alpha for Relation trials compared to Location trials and marked electrodes represent statistically significant clusters. (D/E) Baseline corrected alpha power for Location and Relation trials separately across the entire trial duration. Shown for significant (D) posterior electrode cluster and (E) anterior electrode clusters. Shaded bands represent between-subject standard error of the mean. Each trial event is marked with vertical lines: Fixation (F), Memory Array (M.A.), Delay 1, Cue (C), Delay 2, Test and ITI.

