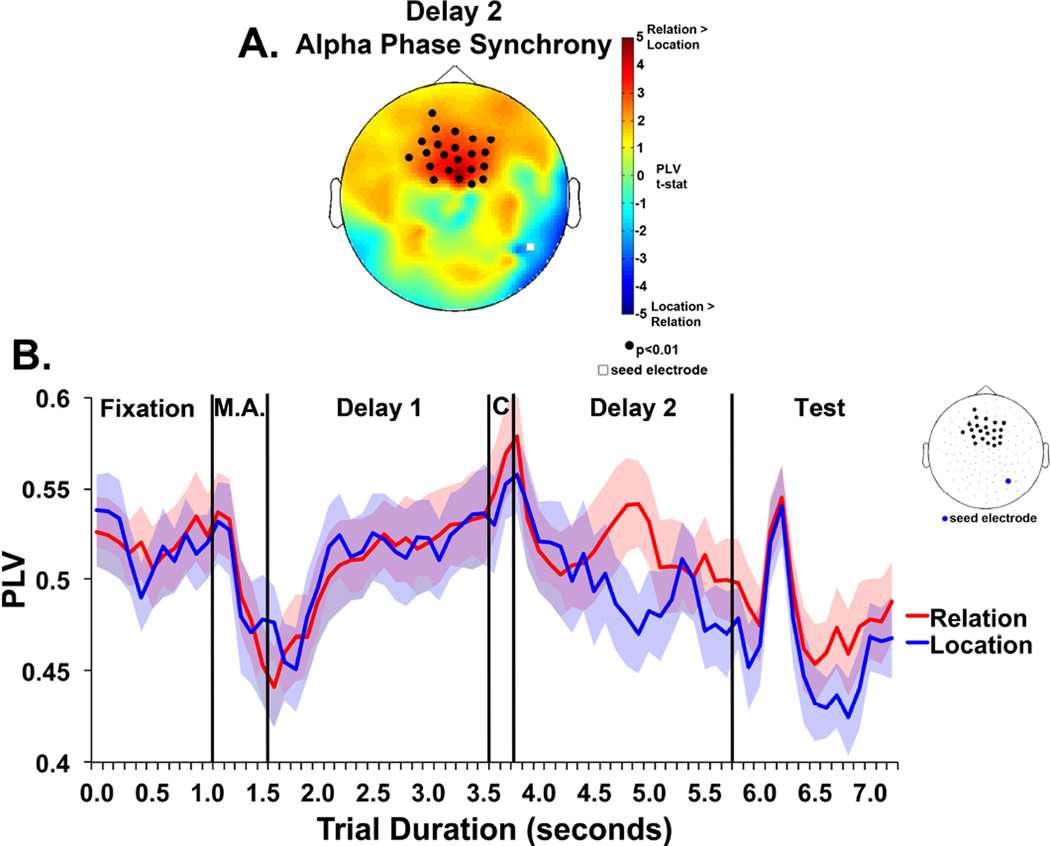
Figure 4.
(A) Results of nonparametric randomization test comparing PLVs for Relation vs. Location trials. Warmer colors indicate greater PLVs for Relation compared to Location trials and marked electrodes indicate a cluster with significantly greater PLVs with the seed electrode for Relation compared to Location. (B) PLVs for Relation and Location trials separately between a right posterior seed and significant frontal electrodes from the Delay 2 randomization test. Each trial event is marked with vertical lines: Fixation, Memory Array (M.A.), Delay 1, Cue (C), Delay 2, and Test. Shaded bands represent between-subject standard error of the mean.

