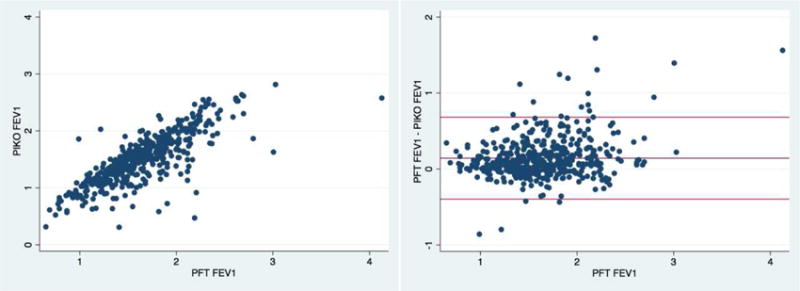
Figure. Relationship between PIKO-1 and Spirometry FEV1.

left panel: Scatterplot demonstrating correlation between PIKO-FEV1 and PFT-FEV1 (Pearson correlation = 0.8); right panel: Bland-Altman plot of PIKO and spirometry-derived FEV1 (mean difference FEV1 = 0.14L, 95% limits of agreement = −0.40 to 0.68L)
