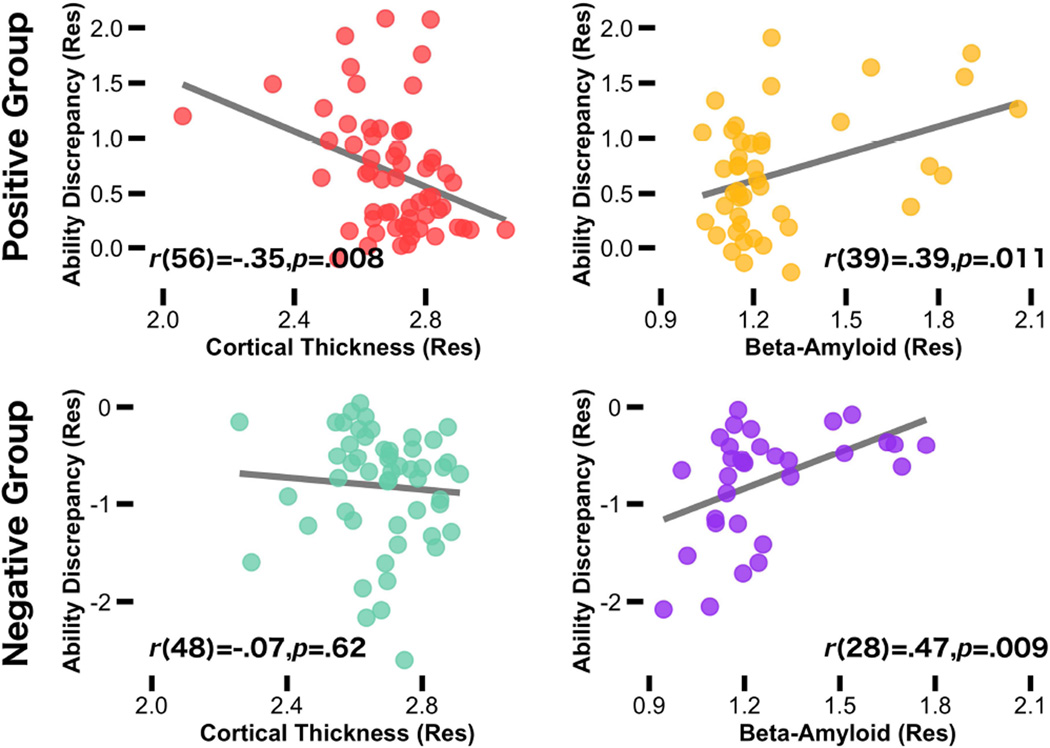
Figure 2.
Scatterplot shows the relationship between AD brain markers and ability discrepancy in all participants as a function of ability discrepancy group (positive and negative). In the positive discrepancy group, discrepancies in ability (crystallized minus fluid) were associated with lower mean cortical thickness across brain regions previously shown to be vulnerable to AD (red), and elevated Aβ deposition (yellow). In the negative discrepancy group, discrepancies in ability were associated with greater Aβ deposition (purple), but no relationship was found for cortical thickness (green). Age and sex were controlled in all variables. Removing the subject with the lowest mean cortical thickness score did not change the strength of the correlation.

