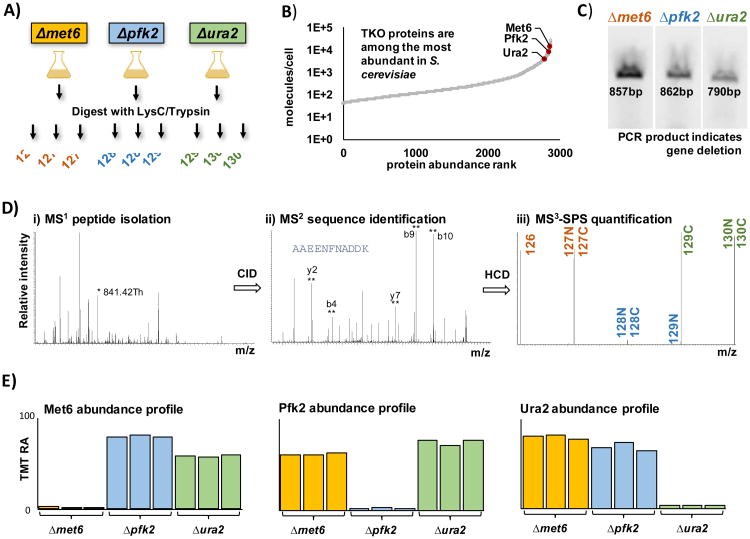
Figure 1. Characteristics of the TKO standard.
A) TMT-labeling strategy for the preparation of the TKO standard. The three deletion stains of high abundant proteins were digested with LysC/trypsin and the protein samples in triplicate were subsequently labeled with TMT. B) Yeast protein abundance curve based on Chong, et al [20] showing the highly abundant, three TKO proteins: Met6, Pfk2, and Ura2. C) PCR validation of the deletion strains for the genes encoding the knocked out proteins of interest using standard KanC and D primer sets (Integrated DNA Technologies) from the Saccharomyces deletion project. The amplified bands are derived from the sequence spanning from an internal region of the KanMX cassette, which replaces the genes of interest into its 3′ untranslated regions. D) SPS-MS3 method which includes i) peptide isolation (*=selected peptide), ii) sequence identification (**=selected SPS fragments), and iii) peptide quantification via SPS ions. E) Bar chart representation of the TMT relative abundance values for each of the three TKO proteins. TMT, tandem mass tag; RA, relative abundance; KO, knockout.

