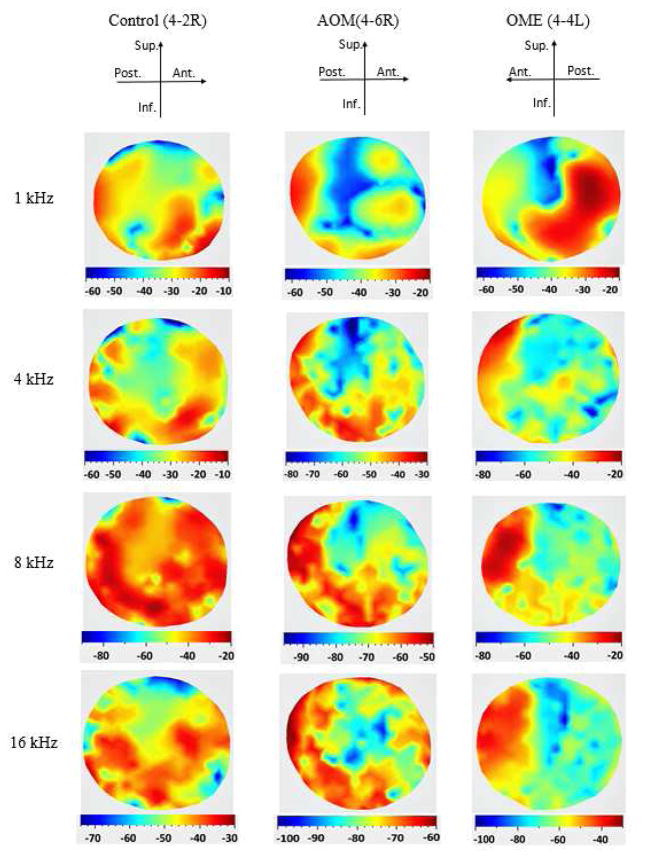
Figure 3.
(color online) Typical displacement magnitude distributions of the TM lateral surface measured by SLDV on three ears: a control ear (4-2R), an AOM ear (4–6R), and an OME ear (4-4L) at four frequencies 1, 4, 8 and 16 kHz. The displacement is normalized by the input sound pressure and represented as a logarithmic scale in decibels (dB) relative to 1 μm/Pa.

