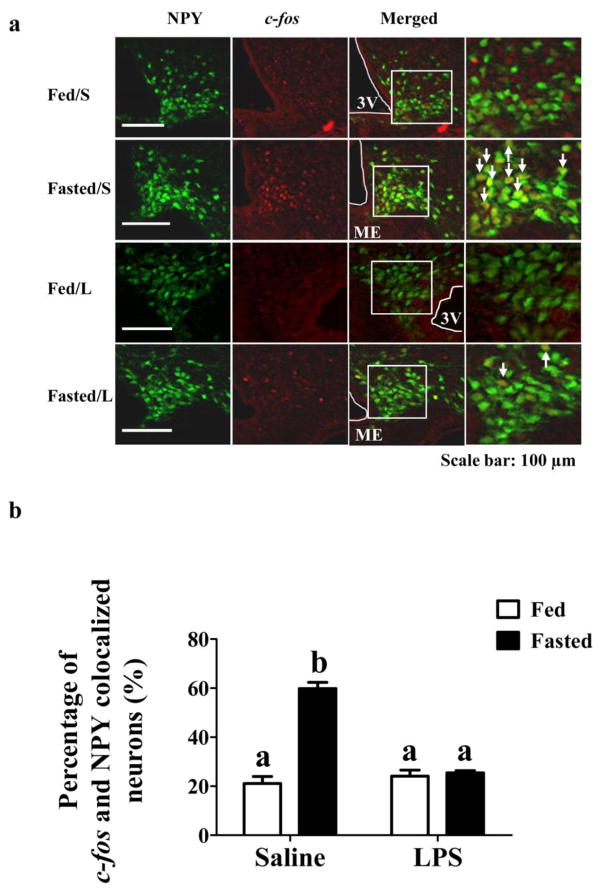
Figure 2. LPS blunted fasting induced c-fos activation in NPY-GFP mice.
(a) Fasting increased c-fos expression in NPY neurons (Fasted/S vs Fed/S); while LPS blocked fasting-induced c-fos expression in NPY/AgRP neurons at the 24 hour time point (Fasted/L). LPS had no effect on c-fos expression in fed mice (Fed/L). White arrows indicate cells in which NPY/AgRP and c-fos are colocalized. (b) Bar graphs represent the percentage of c-fos and GFP colocalized cells. Different letters indicate statistical significance among the four groups determined by two-way ANOVA followed by Tukey’s multiple comparison test (p<0.05; n=3 mice/group).Scale bar: 100 μM. 3V: 3rd cerebral ventricle. Bars with the same letter are not statistically different (p>0.05). ME: Median Eminence. The data are presented as mean ± standard error of the mean (SEM).

