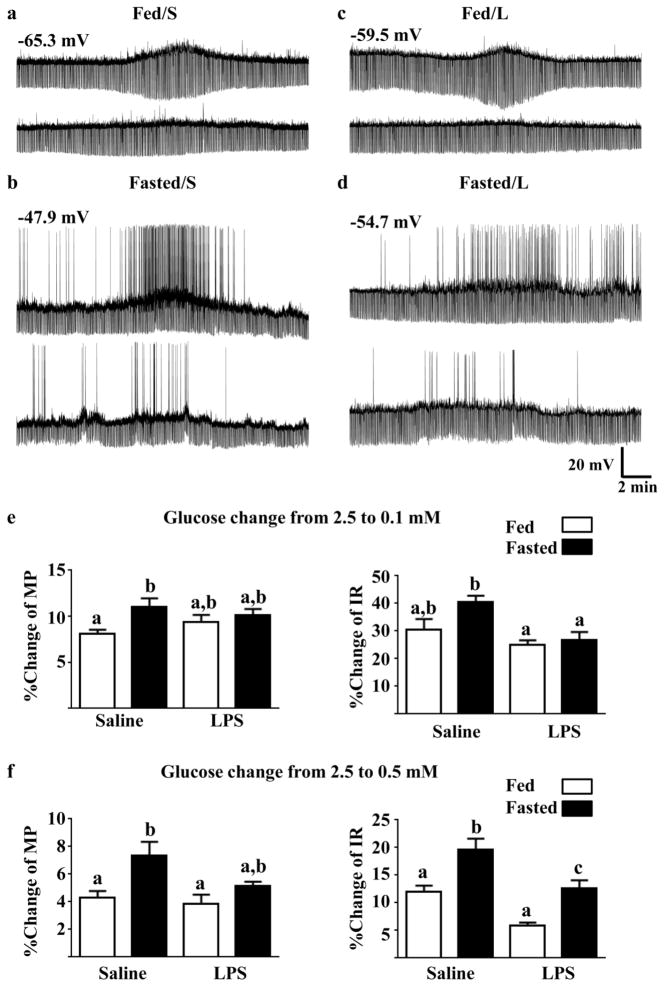
Figure 3. LPS blunted the effect of fasting on the response of NPY-GI neurons to decreased glucose.
(a–d) Representative whole cell current-clamp recordings from NPY-GI neurons. The top trace from each of the four groups shows the response of an NPY/AgRP-GI neuron to a glucose decrease from 2.5 mM to 0.1 mM. The bottom trace from each group shows the response of the same neuron to a glucose decrease from 2.5 mM to 0.5 mM. The resting membrane potential is given above the first trace for each group. The percent change of membrane potential and input resistance relative to that in 2.5 mM glucose was used to quantify changes in the response to a glucose decrease from 2.5 to 0.1 (e) and 0.5 mM (f). Data were analyzed by 2 way ANOVA followed by Tukey’s multiple comparison test. Different letters represent statistical differences (p<0.05; N values ranged from 6–8 neurons from a minimum of 5 mice for each of the measurements). Bars with the same letter are not statistically different (p>0.05). There was a significant increase in depolarization in response to both glucose decreases in the neurons from fasted saline-treated mice compared to fed saline-treated mice. In contrast, the membrane potential response was not enhanced in the fasted vs fed LPS-treated mice. The increase in input resistance in response to decreased glucose was greater in neurons from fasted saline-treated vs LPS-treated mice. The two-way ANOVA results are as follows. Membrane potential 0.1 mM glucose: feeding state F(1,23) = 7.01 (p = 0.01); treatment F(1,23) = 0.07 (p = 0.79); interaction F(1,23) = 2.38 (p = 0.13). Input resistance 0.1 mM glucose: feeding state F(1,23) = 4.076 (0.055); treatment F(1,23) = 10.85 (p = 0.003); interaction F(1,23) = 2.04 (p = 0.16). Membrane potential 0.5 mM glucose: feeding state F(1,24) = 10.56 (p = 0.003); treatment F(1,24) = 3.93 (p = 0.06); interaction F(1,24) = 1.85 (p = 0.19). Input resistance 0.5 mM glucose: feeding state F(1,24) = 22.00 (p < 0.0001); treatment F(1,24) =26.74 (P<0.0001); interaction F(1,24) = 0.11 (p = 0.74).

