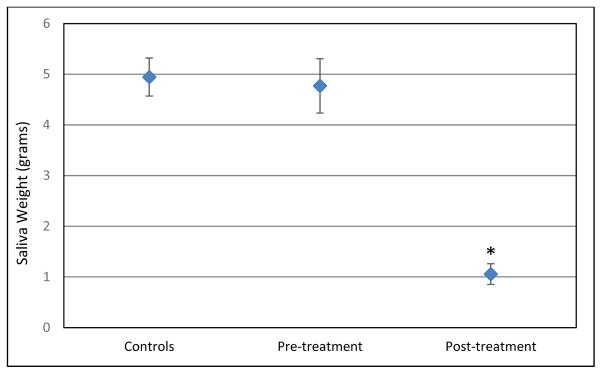
Figure 1.
Mean (average) saliva weights with standard error bars for each group. Asterisk= statistical significance. This graph shows a significant decrease in mean saliva weight from pre- to post-treatment as well as a significant difference between the post-treatment saliva weights and the saliva weights of the control group.

