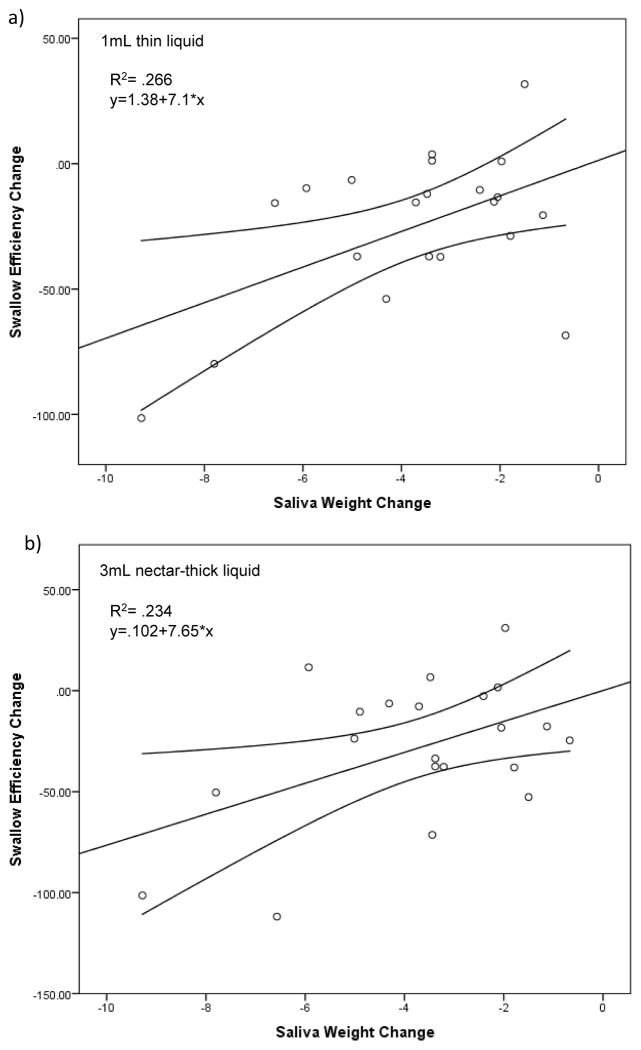
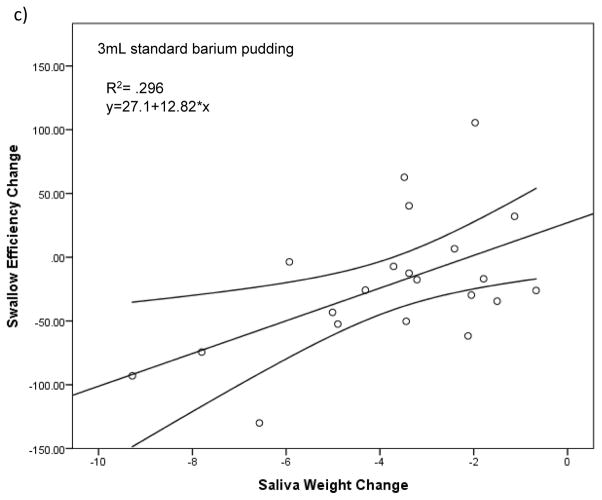
Figure 2.
Each scatterplot (a–c) represents statistically significant (p<.05) simple linear regression models with saliva weight as a predictor of swallow efficiency for each bolus type. Line of best fit and 95% confidence intervals are shown. The graph illustrates that a larger reduction in salivary flow results in a negative change in swallow efficiency for these specific bolus types.


