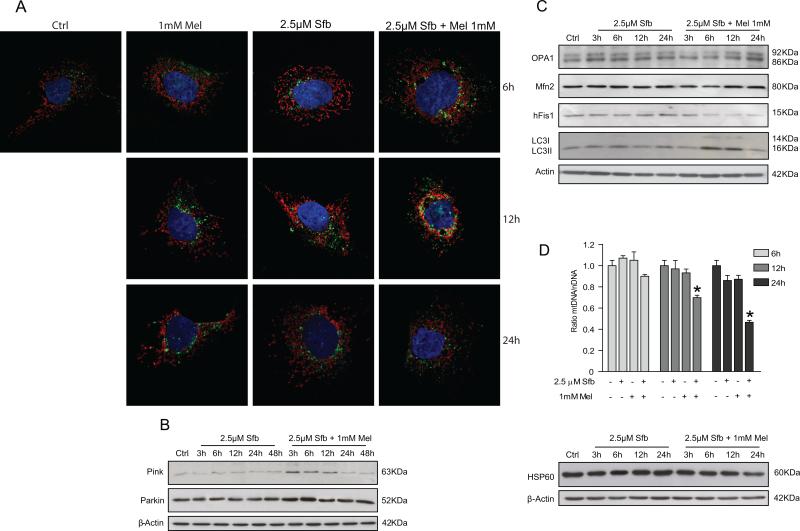
Fig. 2.
Effect of sorafenib and melatonin on mitochondria and lysosome localization, mitophagy and mitochondrial dynamics. Cells were treated with sorafenib (2.5μM), melatonin (1mM) and the combination of both compounds. (A) Confocal images show mitochondria and lysosome localization in the cell. Antibodies for Tom20 (red) and LAMP2 (green) detection were used for mitochondria and lysosomes analysis. Colocalization of both organelles are observed when red and green fluorescences are overlaped. (B and C) Pink and Parkin (mitophagic proteins), LC3 (autophagy protein) and Mfn-2, OPA1 and hFIS1 (fussion and fission proteins) were measured by Western blot at different times. (D) Mitochondria quantity was assessed by measurement of mtDNA content and Hsp60 protein levels. Images are representative for experiments performed in triplicate. Data are expressed as a percentage of mean values ± S.E.M. of three independent experiments. *p < 0.05 versus control cells .

