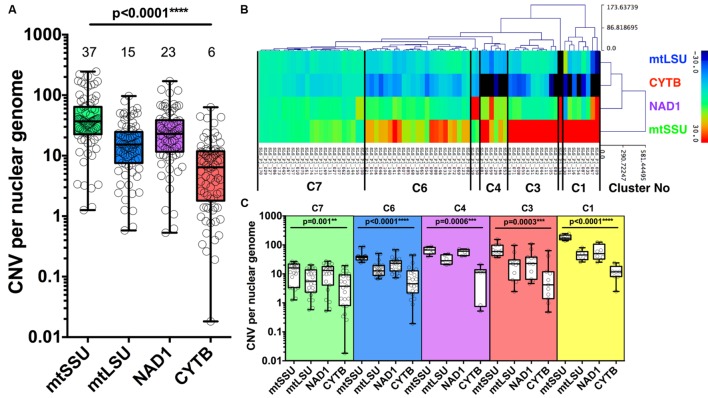
FIGURE 3.
Copy number variation of four mitochondrial genes. Copy number variation (CNV) of P. jirovecii mitochondrial genes varies from gene to gene with a median of six copies for CYTB, 23 for NAD1, 15 for mtLSU, and 37 for mtSSU compared to the mean of two nuclear genes (DHPS and HSP70) (A). Median copy number is indicated in the top of the figure for each target. Heat map of the copy number of the four mitochondrial genes of the 74 BALs as the result of hierarchical clustering analysis (HCA) (B). Five major clusters containing ≥6 samples were defined as indicated between bars (B) with the detailed quantification of each gene within each cluster (C). P-values indicating the significance of the differences between each gene in a given cluster and indicated in the top of the figure for each category.

