FIGURE 3.
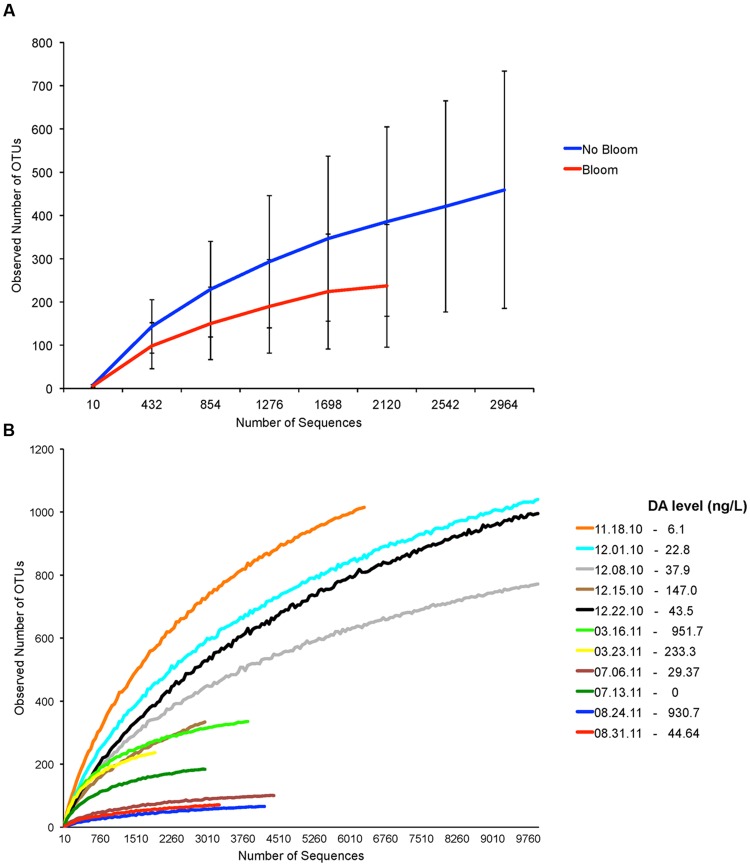
Assessment of bacterial diversity based on number of Operational Taxonomic Units (OTUs) from samples before, during and after Pseudo-nitzschia bloom events in 2010 and 2011. (A) Rarefaction curves generated from samples with no Pseudo-nitzschia bloom and Pseudo-nitzschia bloom. (B) Individual rarefaction curves generated for each sample. Particulate domoic acid level is shown for each sample in the legend. Low-toxin producer P. fraudulenta dominated in 2010 bloom while the high-toxin producer P. australis dominated in 2011 blooms.

