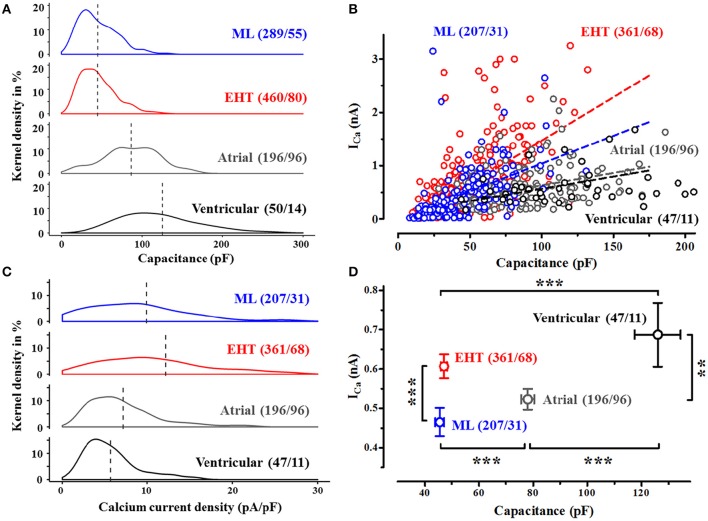
Figure 1.
Cell size and Ca2+-currents in human CM. (A) Frequency distribution of cell capacitance in CM from conventional monolayer culture (ML), EHT and from human adult atrial and ventricular CM expressed as kernel density (details see methods). Dotted lines indicate mean values (compare Table S2). (B) Ca2+-current amplitudes (measured at +10 mV) vs. cell capacitance, dotted lines indicate linear regression fit (compare Table S3). Cells without ICa were not plotted. Same n-numbers as in 1C. (C) Frequency distribution of Ca2+-currents in human CM. Ca2+-currents are expressed as current densities, measured 3.5 min after membrane rupture (test- pulse potential +10 mV, for detailed analysis compare Table S4). (D) Mean values for absolute peak Ca2+-currents vs. cell capacitance. Please note that error bars may be smaller than symbols. Same n-numbers as in 1C. N/N indicates number of cells vs. number of isolation for ML and EHT and number of cells/number patients for atrial and ventricular CM.

