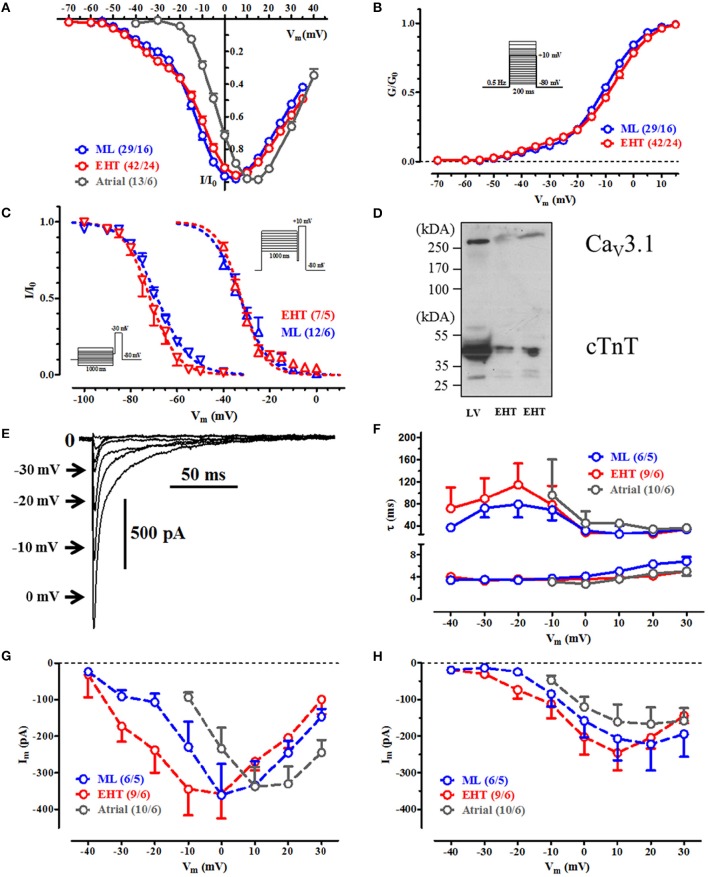
Figure 2.
Voltage dependency of current activation, steady state inactivation and inactivaton during a test-pulse. (A) IV-curves for ML, EHT, and atrial CM. Currents are normalized to its individual maximum. (B) Activation curves for ICa. Conductances were calculated from individual IV-curves. (C) Steady state inactivation curves for T-type Ca2+-channels (at −30 mV, left) and for L-type (at +10 mV, right). (D) Western blot with antibodies against CaV 3.1 and cardiac troponin T (cTnT; loading control) in human adult left ventricle (LV) and engineered heart tissue (EHT). (E–H) Time-dependent inactivation of Ca2+-currents. (E) Original tracings of ICa during initial inactivation phase at different test pulse potentials in hiPSC-CM (For pulse protocol, compare inset in (B). Numbers next to the arrows indicate respective test pulse potential, for clarity some steps were omitted). (F) τ-values for the fast and slow inactivation phase and respective current amplitudes obtained by curve fitting at different test-pulse potentials A (G) and B (H). Please note that in human atrial CM no Ca2+-currents could be recorded at Vm < −10 mV. For details see Table S5. N/N indicates number of cells vs. number of isolation for ML and EHT and number of cells/number patients for atrial CM.

