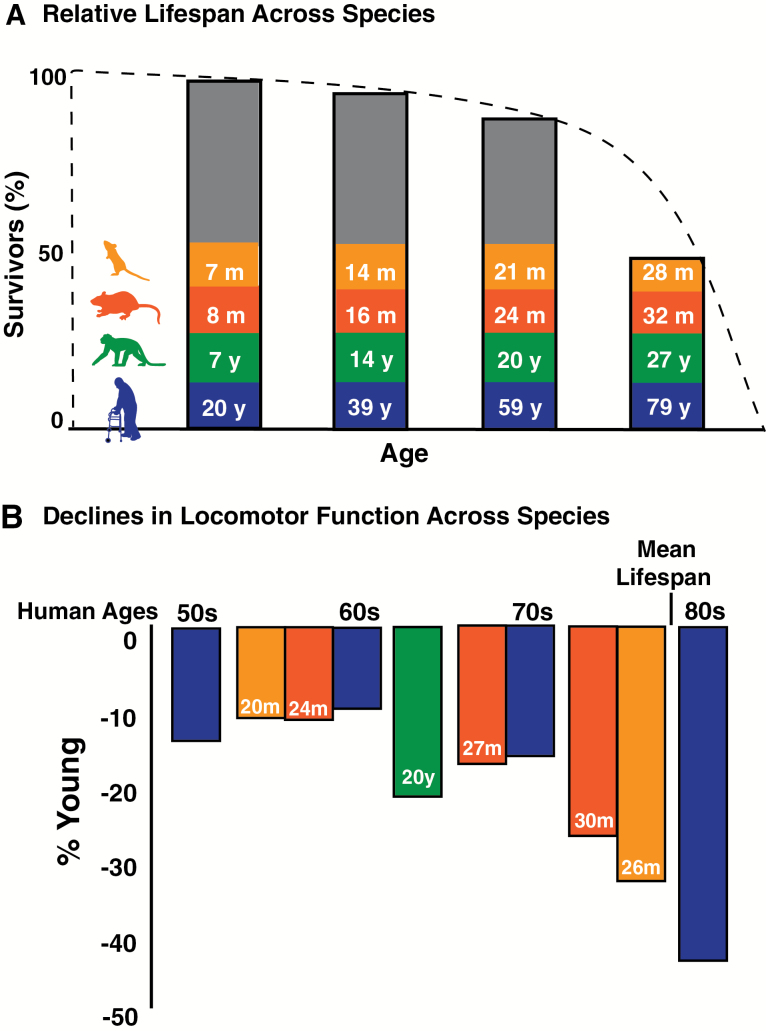
Figure 2.
Relative life spans and age-related declines in locomotor function across species. Analogous ages (A) in man (blue), old world monkeys (green), F1 344xBN rats (red), and C57Bl/6 mice (orange) are calculated based on percentages of mean life span for each species (10,83,84). The dotted line indicates the percent survival. The vertical bars indicate the relative ages, calculated as percent life span for each species. Declines in locomotor function (B) for each species are plotted at their respective relative ages determined by percentage of life span. Percent declines from young humans (20–29 y) were calculated from representative studies with normative data for gait speed (see Justice et al. 8 for detail). Percent declines in locomotor function were determined from scored tests of open field distance, walking track scurry speed, and rearing ability in mice (8), swim speed in rats (11), and gait speed in old world monkeys (10).

