
Figure 2.
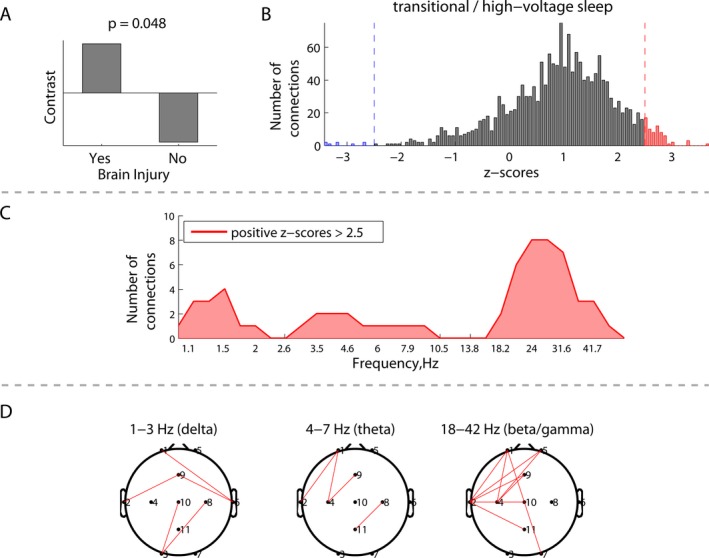
Group differences in EEG connectivity during transitional/high‐voltage sleep between neonates with (N = 5) and without brain injury (N = 15): (A) group contrast; (B) overall distribution of all the z‐scores, each associated with a unique combination of frequencies and connections, and showing the robustness of the contrast (A); (C) distribution of connections from the positive tail (red) in (B) across frequencies, representing significantly higher phase synchronization between the electrodes for the neonates with brain injury; and (D) spatial distributions of the connections from (C) at the delta, theta, and beta/gamma frequencies.