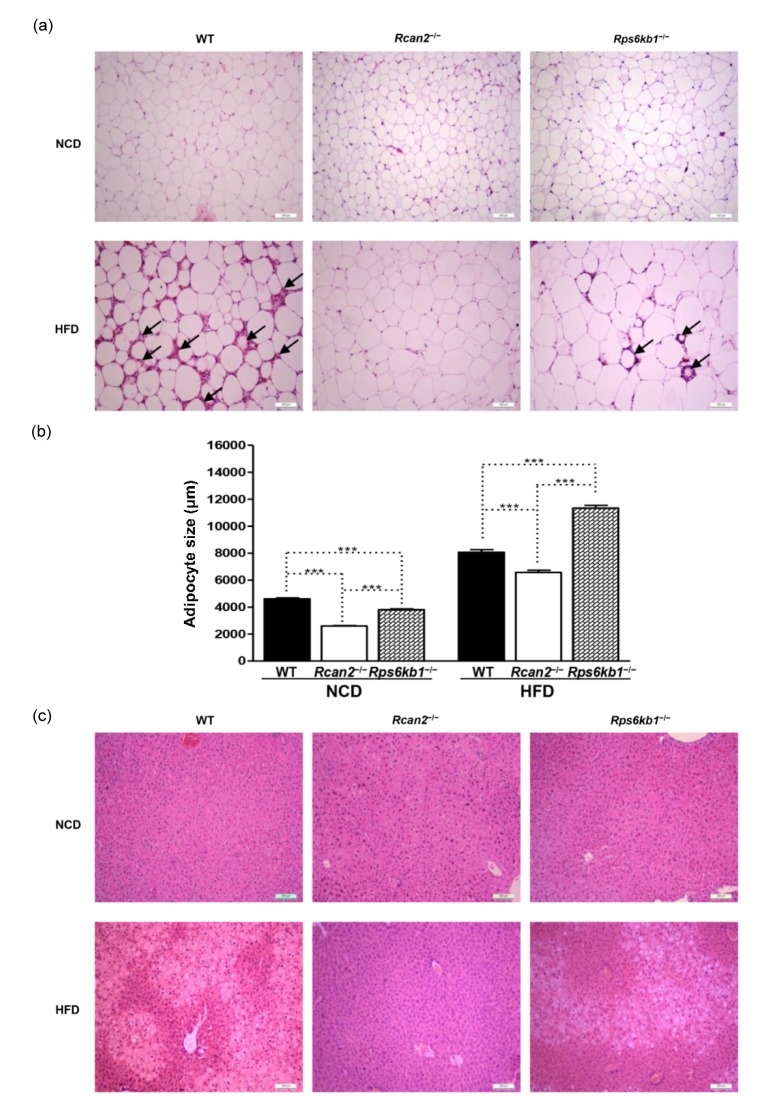
Fig. 4.
Histological analysis of epididymal white adipose tissue (EWAT) and liver
(a) EWAT morphology. Rcan2 −/−, Rps6kb1 −/−, and WT mice were fed either NCD or HFD from postnatal Week 4 to Week 20; animals were humanely sacrificed and histological analysis was performed on EWAT samples. Representative H & E stains of EWAT from each of the six treatment groups are presented. Arrows indicate the presence of crown-like structures in the HFD-fed WT and Rps6kb1 −/− mice. Scale bar: 100 μm. (b) Average size of adipocytes. Adipocyte size was determined using ImageJ software. Statistics were performed in each diet group using one-way ANOVA, and individual group differences were measured using Bonferroni correction. *** P<0.0001. All values are given as mean±SEM. (c) Liver histology. Rcan2 −/−, Rps6kb1 −/−, and WT mice were fed either NCD or HFD from postnatal Week 4 to Week 20; animals were humanely sacrificed and histological analysis was performed on liver samples. Representative micrographs of H & E-stained liver sections demonstrate much more severe steatosis in livers of HFD-fed WT mice than Rps6kb1 −/− mice, while Rcan2 −/− mice did not suffer hepatic steatosis, even on HFD. Scale bar: 100 μm

