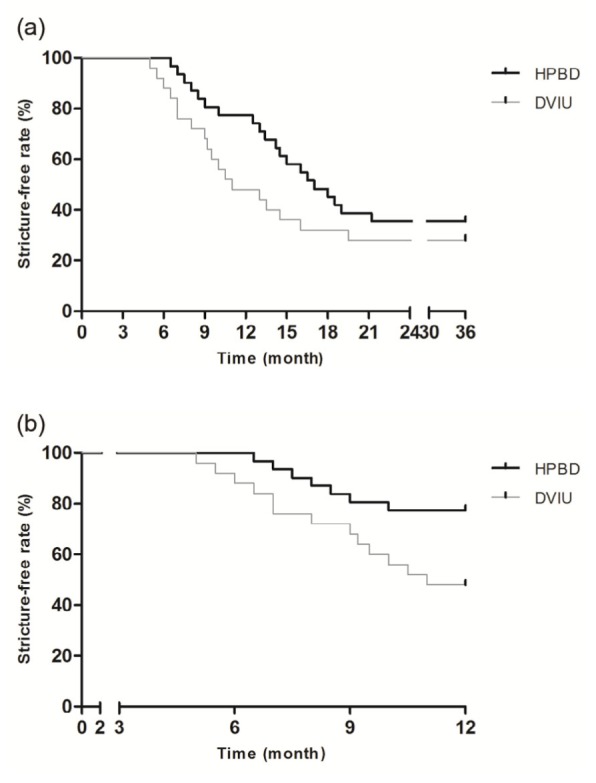
Fig. 2.

Kaplan-Meier curves predicting stricture-free rate after HPBD and DVIU
(a) Survival analysis showing no significant difference at 36 months (P=0.21). (b) Survival analysis showing significantly higher stricture-free rate in the HPBD group at 12 months (P=0.02)
