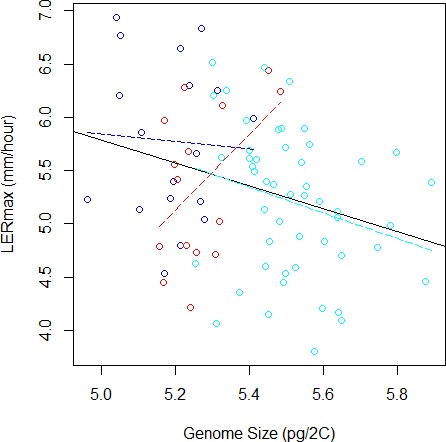
Figure 3. Relation between Genome Size and LERmax within and among groups (Flints in blue, Dents in red, and Tropicals in cyan). The plain line illustrates the linear regression for all data, while colored dotted lines correspond to linear regressions within each group.

When the group variable is included in the ANOVA to correct for genetic structure, the relation between LERmax and GS becomes non-significant. The Tropical group, that contains 50 inbred lines, displays a tendency for negative correlation between LERmax and GS.
