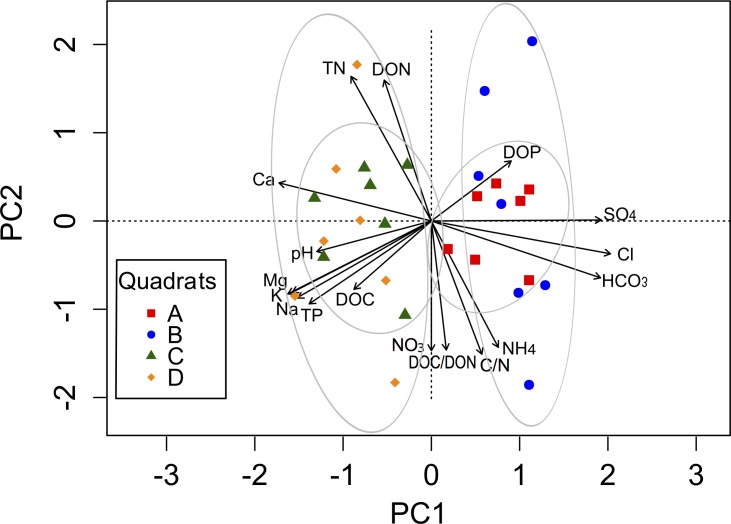
Figure 2. Biplot generated from Principal Component Analysis (PCA) of the standardized soil variables for the four quadrats.
Symbols represent the different quadrats. Each vector points to the direction of increase for a given variable and its length indicates the strength of the correlation between the variable and the ordination scores. Ellipses show confidence intervals of 95% for each sample type. The first component of the PCA analysis accounted for 54.3% of the total variation, and the second component accounted for 34.3% of the variation.

